Note
Go to the end to download the full example code.
2D plate with hole in tension
Simple example of a plate with hole in tension with 2D plane stress assumption.
import fedoo as fd
import pyvista as pv

# Define 2d modeling space using plane stress assumption
fd.ModelingSpace("2Dstress")

# Generate a simple structured mesh "Domain" (plate with a hole).
mesh = fd.mesh.hole_plate_mesh(
    nr=11,
    nt=11,
    length=100,
    height=100,
    radius=20,
    elm_type="quad4",
    sym=False,
    name="Domain",
)

# or read from a mesh that is initialy in 3D (3 coordinates) and remove the 3rd coordinates
# mesh = fd.mesh.import_file('plate_with_hole.msh').as_2d()

# Define an elastic isotropic material with E = 2e5MPa et nu = 0.3 (steel)
material = fd.constitutivelaw.ElasticIsotrop(2e5, 0.3, name="ElasticLaw")

# Create the weak formulation of the mechanical equilibrium equation
fd.weakform.StressEquilibrium("ElasticLaw", name="WeakForm")

# Create a global assembly
fd.Assembly.create("WeakForm", mesh, name="Assembly")

# Define a new static problem
pb = fd.problem.Linear("Assembly")

# Definition of the set of nodes for boundary conditions
left = mesh.find_nodes("X", mesh.bounding_box.xmin)
right = mesh.find_nodes("X", mesh.bounding_box.xmax)

# displacement on left (ux=-0.1mm)
pb.bc.add("Dirichlet", "left", "DispX", -5e-1)
# displacement on right (ux=0.1mm)
pb.bc.add("Dirichlet", "right", "DispX", 5e-1)
# y displacement set in one node to avoid rigid body motion
pb.bc.add("Dirichlet", [0], "DispY", 0)

# Solve problem
pb.set_solver("CG")
pb.solve()

# extract the results from the Assembly object
results = pb.get_results(assemb="Assembly", output_list=["Stress", "Disp", "Strain"])
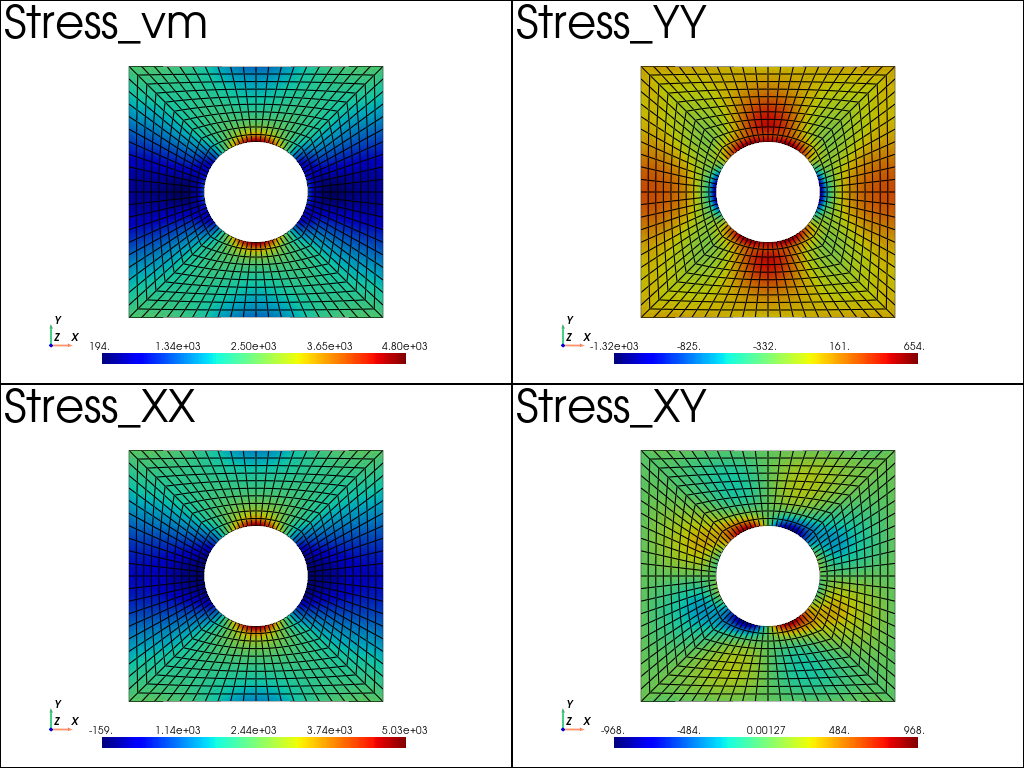
Plot results: The pyvista subplot capability is used to plot in the same figure:
The Von-Mises stress
The XX, YY, XY component of stress tensor
pl = pv.Plotter(shape=(2, 2))

### to use the background plotter, uncomment the following lines ###
# from pyvistaqt import BackgroundPlotter
# pl = BackgroundPlotter(shape = (2,2))

results.plot("Stress", "vm", "Node", plotter=pl)
pl.subplot(1, 0)
results.plot("Stress", "XX", "Node", plotter=pl)
pl.subplot(0, 1)
results.plot("Stress", "YY", "Node", plotter=pl)
pl.subplot(1, 1)
results.plot("Stress", "XY", "Node", plotter=pl)
pl.show()
Total running time of the script: (0 minutes 0.664 seconds)