Note
Go to the end to download the full example code.
Comparison of objective rates
This example show the well-known spurious oscillations that can occur in the Zaremba-Jauman rate when simulating elastic responses under large transformations. The results are compared with the Green-Naghdi and logarithmic Xiao-Meyers-Bruhns rates, which do not exhibit such oscillations.
import numpy as np
import matplotlib.pyplot as plt
import simcoon as sim
import os

plt.rcParams["figure.figsize"] = (18, 10)  # configure the figure output size

plt.rc("text", usetex=True)
plt.rc("font", family="serif")
We first consider an material with isotropic elastic behavior defined by its Young modulus and Poisson ratio. The material is subjected to a large simple shear deformation. Not that of course this example is only illustrative since for large deformations elastic materials are not physically meaningful.
umat_name = "ELISO"  # This is the 5 character code for the elastic-isotropic subroutine
nstatev = 1  # The number of scalar variables required, only the initial temperature is stored here

E = 70000.0
nu = 0.3
alpha = 1.0e-5

psi_rve = 0.0
theta_rve = 0.0
phi_rve = 0.0
solver_type = 0

props = np.array([E, nu, alpha])

path_data = "data"
pathfile = "path.json"

colors = ["blue", "red", "green", "black"]
In here the the three objective rates are compared : Jaumann, Green-Naghdi and Logarithmic
rate = ["Jaumann", "Green-Naghdi", "Logarithmic"]
The loading path is described in data/path.json. Its block has
"control_type": "F": the deformation gradient itself is prescribed, component
by component.
The simulation therefore consists in a simple shear up to a shear transformation of 5.0 time is set to 5 seconds, with 100 increments, so that time matches the value of the shear transformation.
from pathlib import Path

this_dir = Path(os.getcwd())
data_file = this_dir / path_data / pathfile

print(f"----- Contents of {data_file.name} -----")
print(data_file.read_text().strip())
print("----------------------------------------")
----- Contents of path.json -----
{
  "initial_temperature": 290.0,
  "corate": "logarithmic_R",
  "blocks": [
    {
      "control_type": "F",
      "ncycle": 1,
      "steps": [
        {
          "thermomechanical": false,
          "mode": "linear",
          "time": 5.0,
          "ninc": 1000,
          "Dn_init": 1.0,
          "Dn_mini": 0.1,
          "control": [
            "strain",
            "strain",
            "strain",
            "strain",
            "strain",
            "strain",
            "strain",
            "strain",
            "strain"
          ],
          "value": [
            1.0,
            5.0,
            0.0,
            0.0,
            1.0,
            0.0,
            0.0,
            0.0,
            1.0
          ],
          "T_final": 290.0
        }
      ]
    }
  ]
}
----------------------------------------
Next is a loop over the different objective rates where the simulation is run
fig, axes = plt.subplots(2, 2, figsize=(18, 10))
plot_info = [
    (0, 0, "e11", r"Strain ($\varepsilon_{11}$)"),
    (0, 1, "e12", r"Strain ($\varepsilon_{12}$)"),
    (1, 0, "e22", r"Strain ($\varepsilon_{22}$)"),
    (1, 1, "rotation", r"rotation angle (rad)"),
]

for i, rate_name in enumerate(rate):
    corate_type = i
    # The path file is parsed in Python and the case runs in memory: the rotation
    # history comes back as a (3, 3, N) array, no result file is written.
    blocks, T_init, _ = sim.solver.load_path_json(os.path.join(path_data, pathfile))
    res = sim.solver.solve(
        blocks,
        umat_name,
        props,
        nstatev,
        T_init=T_init,
        solver_type=solver_type,
        corate=corate_type,
        orientation=(psi_rve, theta_rve, phi_rve),
    )
    time = res["Time"]
    # res["Strain"] is the strain integrated with the objective rate of the run, which is
    # what the comparison is about; res["LogStrain"] and res["GreenLagrange"], computed from F,
    # are the same for every rate.
    e11, e22, e12 = res["Strain"][0], res["Strain"][1], res["Strain"][3]
    r11 = np.minimum(res["R"][0, 0], 1.0)
    values = [e11, e12, e22, np.arccos(r11)]
    for ax_idx, (row, col, _, ylabel) in enumerate(plot_info):
        axes[row, col].plot(time, values[ax_idx], c=colors[i], label=rate_name)

for row, col, _, ylabel in plot_info:
    axes[row, col].set_xlabel(r"Time (s)", size=15)
    axes[row, col].set_ylabel(ylabel, size=15)
    axes[row, col].legend(loc=2)
    axes[row, col].grid(True)
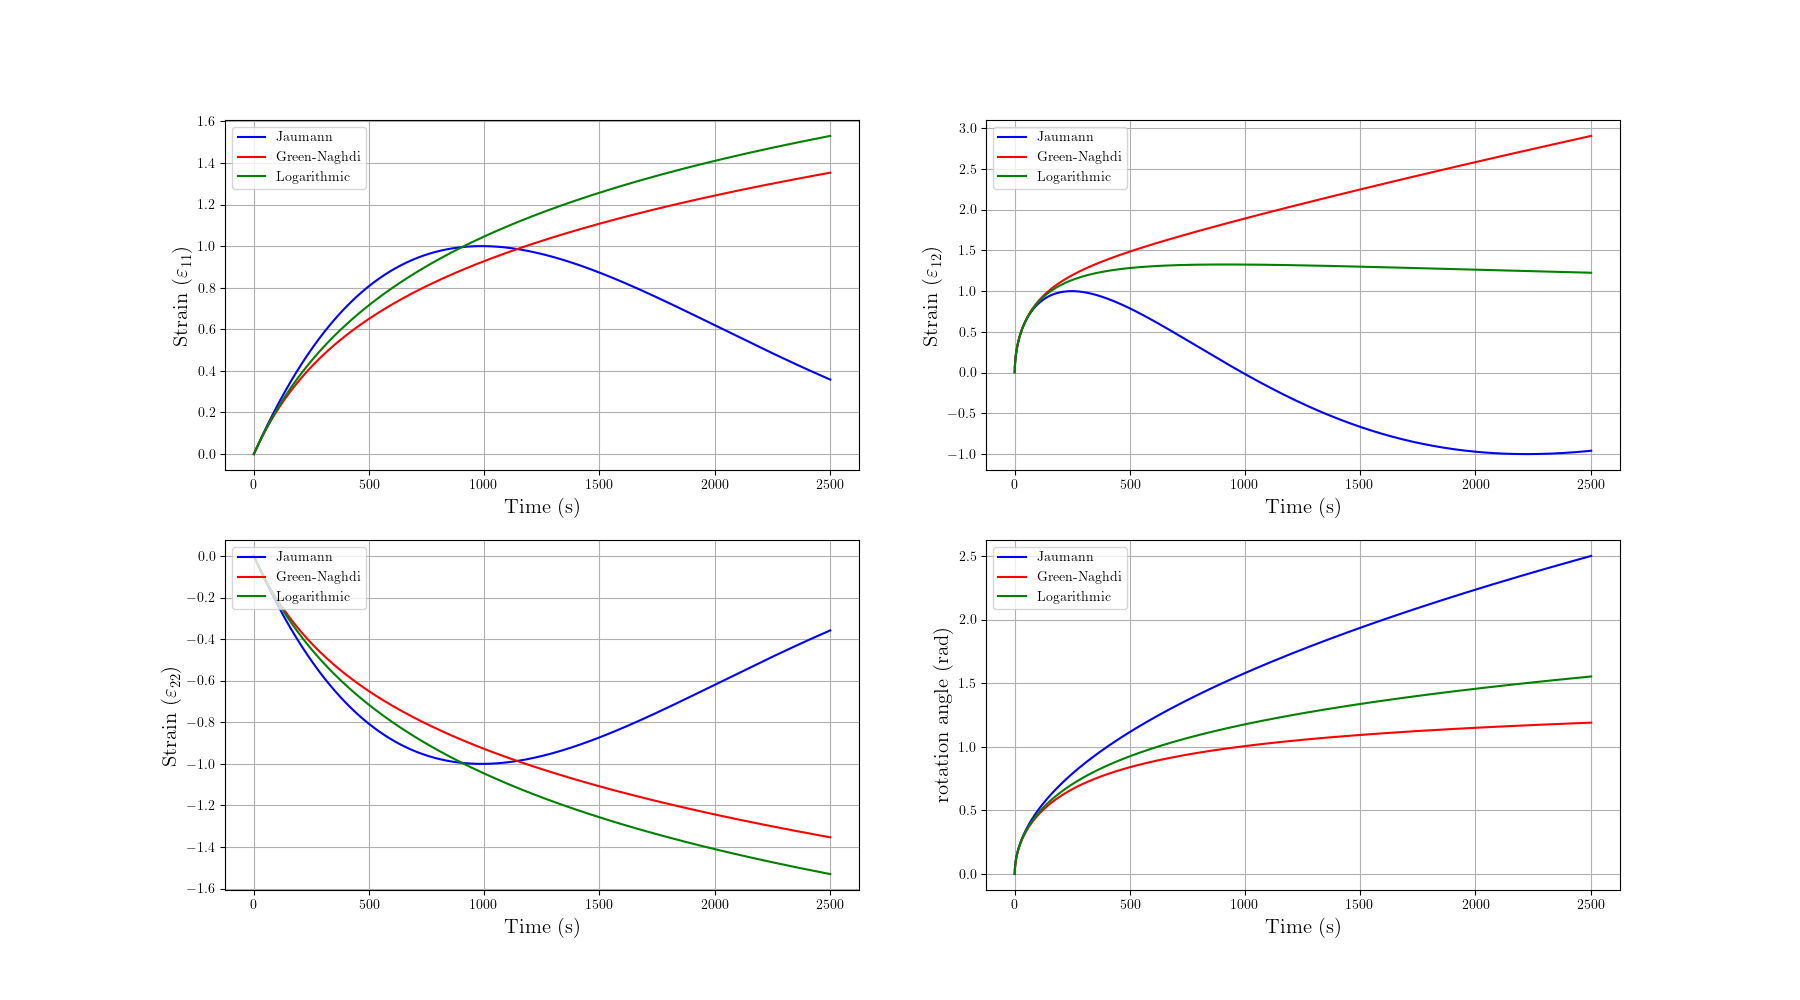
Note that the Jaumann rate exhibits spurious oscillations in the stress and strain response, while the Green-Naghdi and Logarithmic rates provide smooth responses. This is a well-known issue with the Jaumann rate when dealing with large simple shear transformation. The Green-Naghdi and Logarithmic rates do not suffer from this problem, making them more suitable for simulations involving large deformations and rotations.
While logarithmic rates are often considered the most accurate for large deformations, please note that the induced rotation is however not correct. Only the Green-Naghdi rate provides the exact rotation for rigid body motions corresponding to the RU (or VR) decomposition.
Total running time of the script: (0 minutes 5.306 seconds)