Note
Go to the end to download the full example code.
Very simple example with multiple element type.
- The key points are:
define two separated mesh that share to the same node list with different elements.
create two separated Assembly that are combined in a single AssemblySum object.
extract/save results separatedly for each elm_type.
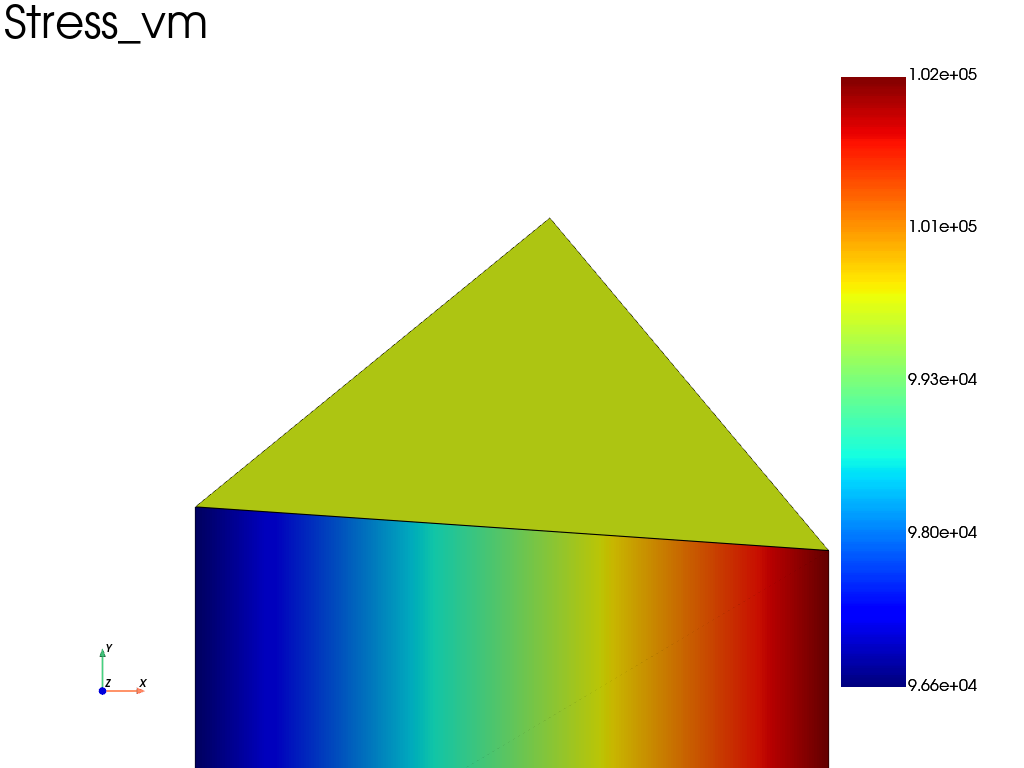
Extract and plot results: For now, the DataSet class is only available for a single element type. To plot the results, we need to extract two separated solution and plot two separted meshes.
import fedoo as fd
import numpy as np

# Generate a mesh with a 'quad4' element
mesh1 = fd.mesh.rectangle_mesh(2, 2, elm_type="quad4")

# Add a new node not connected to the quad mesh
mesh1.add_nodes([0.5, 1.866])

# Generate a new 'tri3' mesh with the same list of nodes (important)
mesh2 = fd.Mesh(mesh1.nodes, elements=np.array([[2, 3, 4]]), elm_type="tri3")

# Define equations as usual (constitutivelaw + weakform)
fd.ModelingSpace("2Dstress")
material = fd.constitutivelaw.ElasticIsotrop(2e5, 0.3)
wf = fd.weakform.StressEquilibrium(material)

# Create a global assembly
assembly1 = fd.Assembly.create(wf, mesh1)
assembly2 = fd.Assembly.create(wf, mesh2)
assembly = assembly1 + assembly2

# Define a new static problem
pb = fd.problem.Linear(assembly)

# Extract set of nodes for boundary conditions (here an use mesh1 or mesh2
# because they share the same nodes)
left = mesh1.find_nodes("X", mesh1.bounding_box.xmin)
right = mesh1.find_nodes("X", mesh1.bounding_box.xmax)

# displacement on left (ux=-0.1mm)
pb.bc.add("Dirichlet", "left", "Disp", 0)
# displacement on right (ux=0.1mm)
pb.bc.add("Dirichlet", "right", "DispX", 0.5)


# Solve problem
pb.solve()
Extract and plot results: For now, the DataSet class is only available for a single element type. To plot the results, we need to extract two separated solution and plot two separted meshes.
# extract the results from the two assembly objects
results1 = pb.get_results(assembly1, output_list=["Stress", "Disp", "Strain"])
results2 = pb.get_results(assembly2, output_list=["Stress", "Disp", "Strain"])

plotter = results1.plot("Stress", "vm", show=False)
results2.plot("Stress", "vm", plotter=plotter)
plotter.show()
Total running time of the script: (0 minutes 0.212 seconds)