Note
Go to the end to download the full example code.
Johnson-Cook plasticity with adiabatic self-heating (thermomechanical)
import os
import numpy as np
import matplotlib.pyplot as plt
import simcoon as sim

plt.rcParams["figure.figsize"] = (18, 10)
The thermomechanical Johnson-Cook law (EPJCK) couples the rate- and temperature-dependent yield stress
with the heat equation: the plastic dissipation is the heat source (no Taylor-Quinney coefficient, the stored part of the plastic work is \(B p^n\) integrated over \(p\)), and the temperature rise softens the material through \(\partial \Phi / \partial T \neq 0\). Thirteen parameters are required: the density \(\rho\) and the specific heat \(c_p\), then the eleven parameters of the mechanical law.
Parameters of AISI 4340 steel (Johnson and Cook, 1983), in the MPa / mm / t / s / K system (\(\rho\) in t/mm\(^3\), \(c_p\) in mJ/(t K)):
umat_name = "EPJCK"
nstatev = 9

rho = 7.85e-9  # density (t/mm^3)
c_p = 4.75e8  # specific heat (mJ/(t K))
E = 200000.0  # Young's modulus (MPa)
nu = 0.33  # Poisson's ratio
alpha = 1.0e-5  # CTE
A_jc = 792.0  # initial yield stress (MPa)
B_jc = 510.0  # hardening coefficient (MPa)
n_jc = 0.26  # hardening exponent
C_jc = 0.014  # strain-rate sensitivity
edot0 = 1.0  # reference strain rate (1/s)
m_jc = 1.03  # thermal softening exponent
T_ref = 293.0  # reference temperature (K)
T_melt = 1793.0  # melting temperature (K)

psi_rve = 0.0
theta_rve = 0.0
phi_rve = 0.0
solver_type = 0
corate_type = 3

props = np.array([rho, c_p, E, nu, alpha, A_jc, B_jc, n_jc, C_jc, edot0, m_jc, T_ref, T_melt])
path_data = "../data"
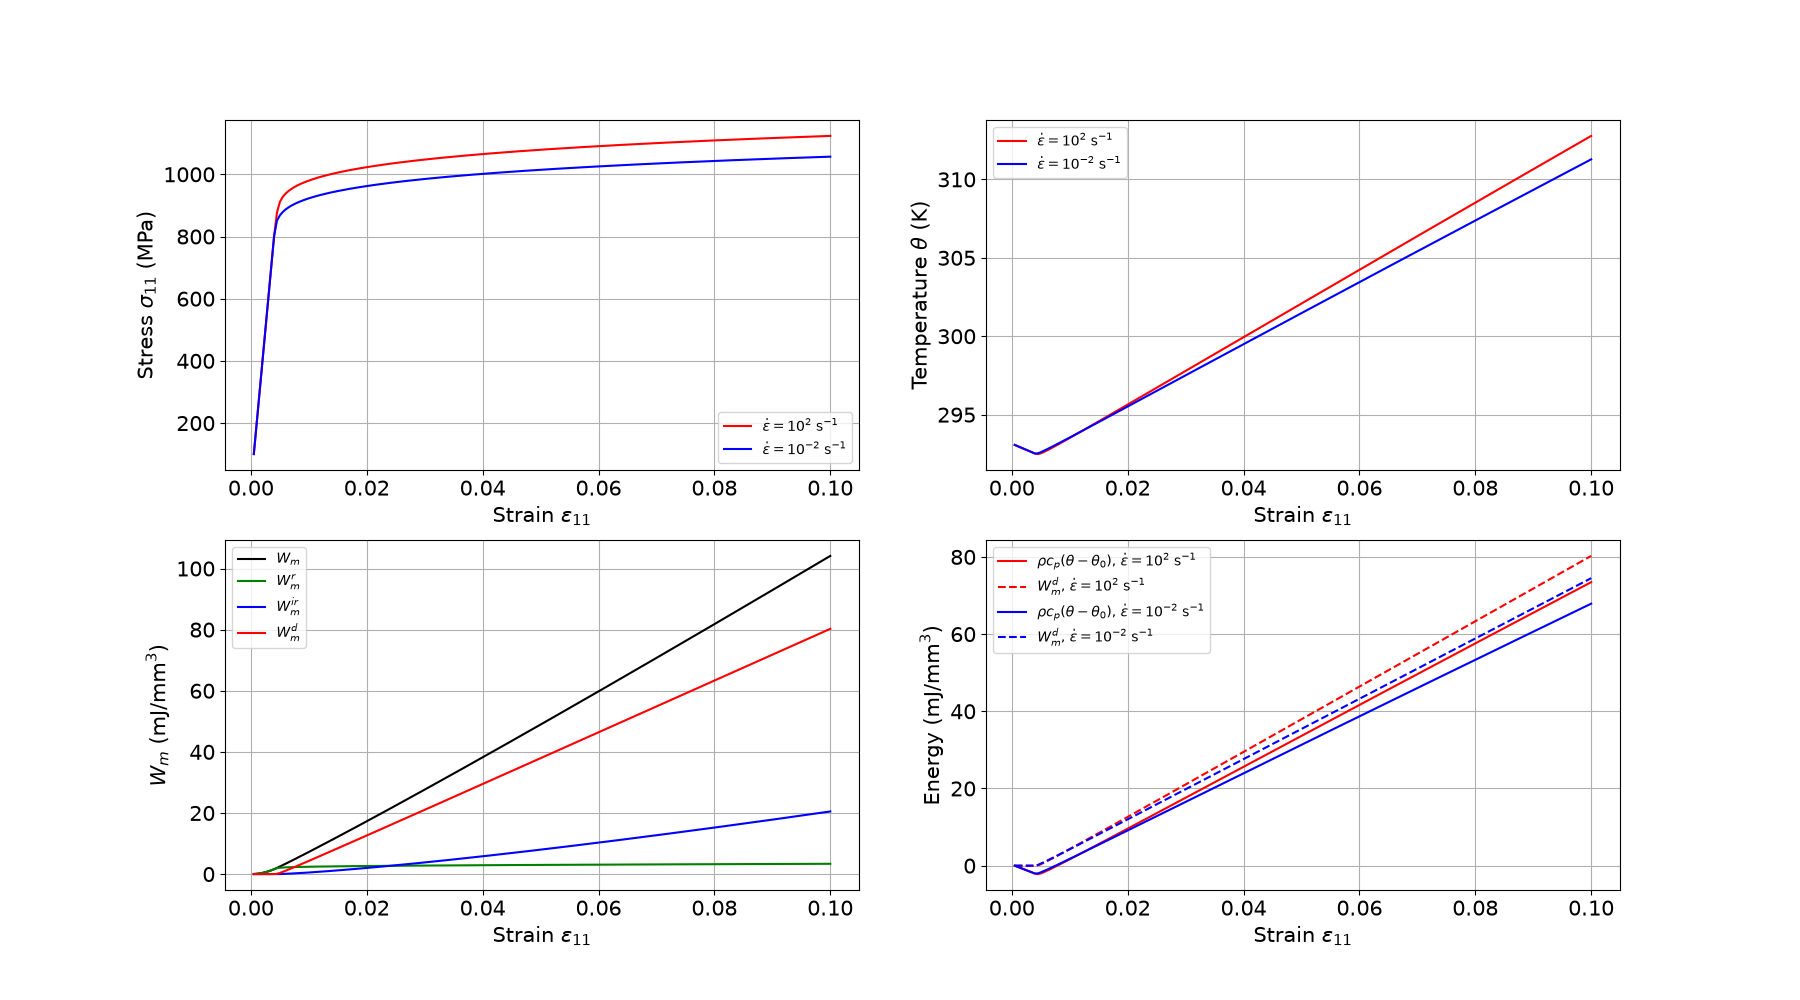
Adiabatic tension at two strain rates
A 10 % tension with no heat exchange (prescribed heat flux \(Q = 0\)) at \(10^{2}\) s\(^{-1}\) (1 ms) and at \(10^{-2}\) s\(^{-1}\) (10 s). The material heats up by the dissipated work in both cases; the fast one is also rate-hardened.
configs = {
    "fast": {"pathfile": "THERM_EPJCK_path.json", "label": r"$\dot{\varepsilon} = 10^{2}$ s$^{-1}$", "c": "red"},
    "slow": {"pathfile": "THERM_EPJCK_path_slow.json", "label": r"$\dot{\varepsilon} = 10^{-2}$ s$^{-1}$", "c": "blue"},
}

results = {}
for key, cfg in configs.items():
    blocks, T_init, _ = sim.solver.load_path_json(os.path.join(path_data, cfg["pathfile"]))
    results[key] = sim.solver.solve(
        blocks,
        umat_name,
        props,
        nstatev,
        T_init=T_init,
        solver_type=solver_type,
        corate=corate_type,
        orientation=(psi_rve, theta_rve, phi_rve),
    )
Plotting the results
Stress-strain curve, temperature rise, mechanical work terms and the adiabatic energy balance \(\rho c_p (T - T_0)\) against the dissipated work \(W_m^d\).
fig = plt.figure()

ax = fig.add_subplot(2, 2, 1)
plt.grid(True)
plt.tick_params(axis="both", which="major", labelsize=15)
plt.xlabel(r"Strain $\varepsilon_{11}$", size=15)
plt.ylabel(r"Stress $\sigma_{11}$ (MPa)", size=15)
for key, cfg in configs.items():
    res = results[key]
    plt.plot(res["Strain"][0], res["Stress"][0], c=cfg["c"], label=cfg["label"])
plt.legend(loc="best")

ax = fig.add_subplot(2, 2, 2)
plt.grid(True)
plt.tick_params(axis="both", which="major", labelsize=15)
plt.xlabel(r"Strain $\varepsilon_{11}$", size=15)
plt.ylabel(r"Temperature $\theta$ (K)", size=15)
for key, cfg in configs.items():
    res = results[key]
    plt.plot(res["Strain"][0], res["Temp"], c=cfg["c"], label=cfg["label"])
plt.legend(loc="best")

ax = fig.add_subplot(2, 2, 3)
plt.grid(True)
plt.tick_params(axis="both", which="major", labelsize=15)
plt.xlabel(r"Strain $\varepsilon_{11}$", size=15)
plt.ylabel(r"$W_m$ (mJ/mm$^3$)", size=15)
res = results["fast"]
Wm, Wm_r, Wm_ir, Wm_d = res["Wm"]
e11 = res["Strain"][0]
plt.plot(e11, Wm, c="black", label=r"$W_m$")
plt.plot(e11, Wm_r, c="green", label=r"$W_m^r$")
plt.plot(e11, Wm_ir, c="blue", label=r"$W_m^{ir}$")
plt.plot(e11, Wm_d, c="red", label=r"$W_m^d$")
plt.legend(loc="best")

ax = fig.add_subplot(2, 2, 4)
plt.grid(True)
plt.tick_params(axis="both", which="major", labelsize=15)
plt.xlabel(r"Strain $\varepsilon_{11}$", size=15)
plt.ylabel(r"Energy (mJ/mm$^3$)", size=15)
for key, cfg in configs.items():
    res = results[key]
    T0 = res["Temp"][0]
    plt.plot(res["Strain"][0], rho * c_p * (res["Temp"] - T0), c=cfg["c"], label=r"$\rho c_p (\theta - \theta_0)$, " + cfg["label"])
    plt.plot(res["Strain"][0], res["Wm"][3], c=cfg["c"], linestyle="--", label=r"$W_m^d$, " + cfg["label"])
plt.legend(loc="best")

plt.show()
Total running time of the script: (0 minutes 0.291 seconds)